
Woo! I had a great weekend painted my bike and got to go to ACL (Austin City Limits) on Sunday. Unfortunately I missed Chiddy Bang, but did get to see Fleet Foxes and Arcade Fire, both of which were good. Who was your favorite act at ACL? If you went that is. Well now it’s Monday and reality is settling in, no more being outside and having to worry about nothing but watching bands. It’s time to go to class and work, oh the joys of the workweek. Lucky for you though, today is the day we debut our first original infographic!
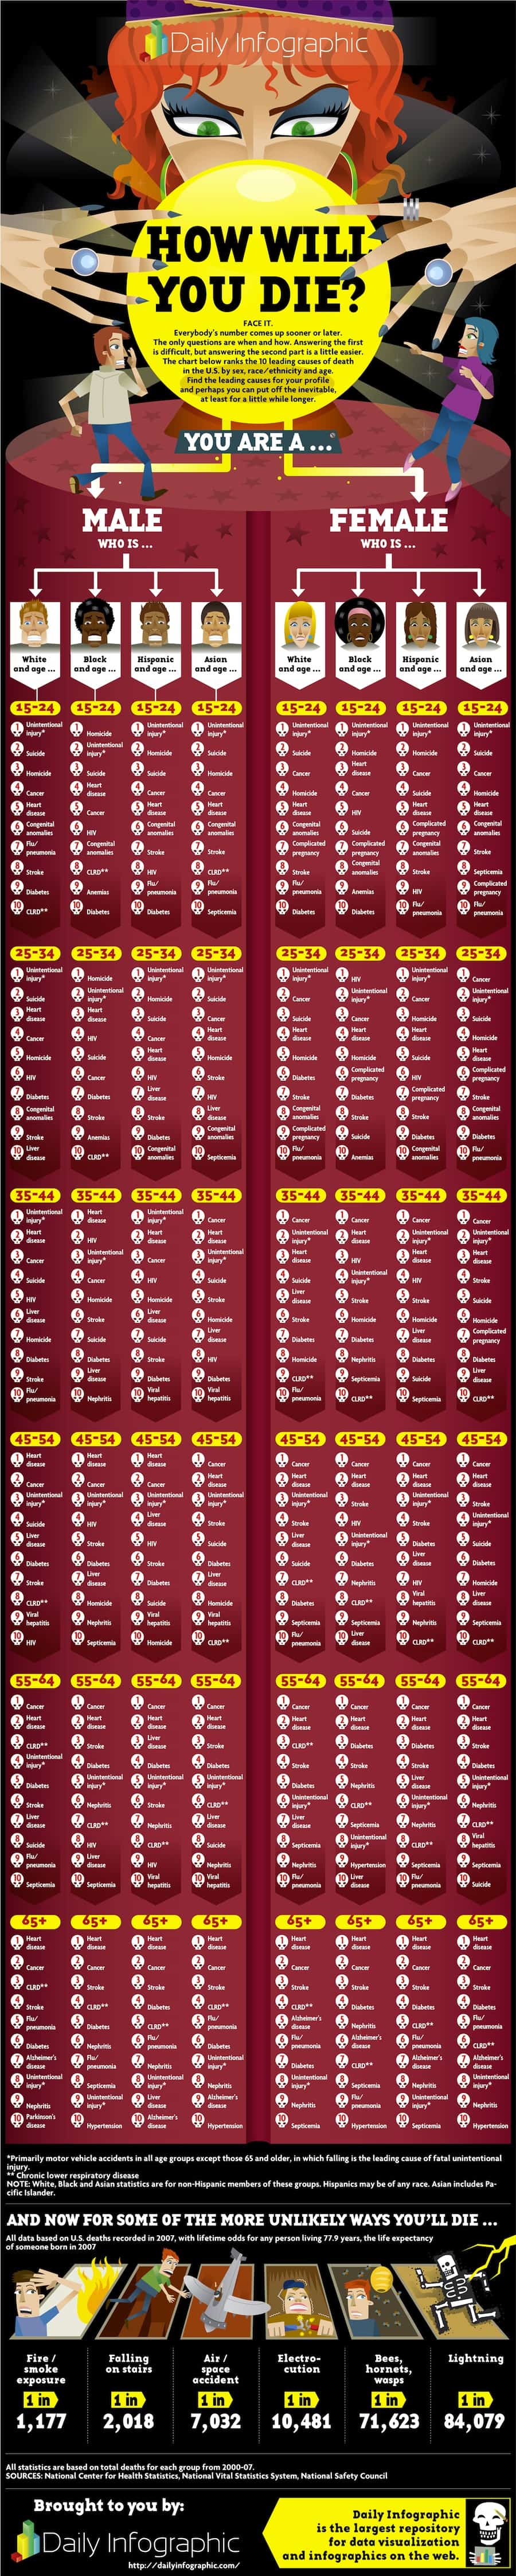
To make sure your week starts off nice and cheery today’s infographic How will you die? presents the most likely way you will die depending on race, gender, and age. If you are a 21 year old Hispanic like me, we are most likely to die of unintentional injury which according to today’s infographic is most likely to be a car accident. If you are 65 or older, no matter your ethnicity, you are most likely to die from heart disease, congratulations.
Thanks to our partner infographic world for helping with the creation of today’s infographic. Enjoy and share!